Examples of Other Proxies for Efficiency
We present examples here of two measures normally used as proxies for efficiency. They are: Unit Cost and Overhead Ratio. We compare the unit cost method to both productivity and efficiency and compare the overhead ratio method to efficiency.
We also make a distinction between what we call the operations unit cost and the accounting unit cost.

Operations Unit Cost as a Proxy
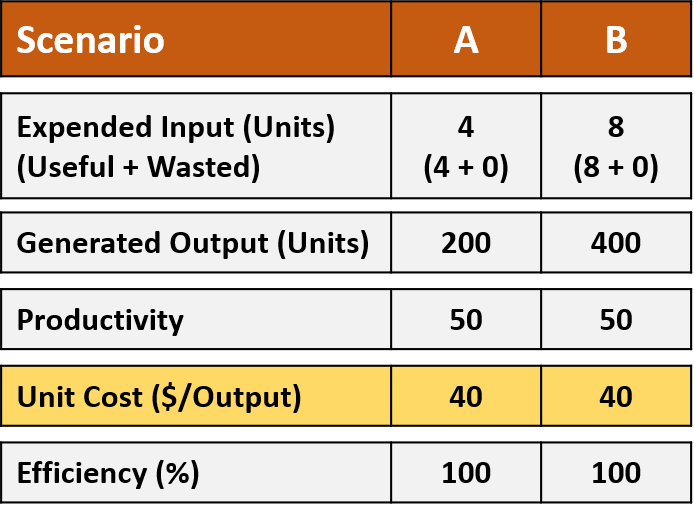
The operations unit cost ratio is the inverse of productivity (i.e. input/output rather than output/input). Here the cost of the input is used rather than the number of units of input used in productivity. Generally, lower operations unit costs are considered to be “less wasteful and thus more efficient”.
In the below, a cost of $2,000 per unit of input has been used.
Case 1: No Waste
The Ideal Case. No waste in either scenario.
Case 2: Same Amount of Waste
Added 1 unit of waste to both scenarios in Case 1.

Case 3: Different Amounts of Waste
Added an additional 1 unit of waste to Scenario B in Case 2.

In Case 1, all three measures (productivity, unit cost and efficiency) lead to the right conclusion that both scenarios have the same amount (in this case zero) of waste.
In Case 2, we see that all three measures give the wrong impression that Scenario B has less waste than Scenario A.
Similarly, in Case 3, all three measures again give the wrong impression that both scenarios have the same amount of waste.
The wrong conclusions in Cases 2 and 3 are due to a phenomenon known as the Base Effect. This Base Effect impacts all three measures and makes them unreliable when their bases of comparison are vastly different. This is the primary reason why it is usually recommended that only scenarios with similar bases are benchmarked.
What sets the efficiency measure apart from the other two measures is that, since, the only way to calculate efficiency is to first quantify how much of the Expended Input is wasted, we can overcome the impact of the Base Effect by simply drawing our conclusions using the actual value of the waste that was determined prior to the calculation of efficiency. With productivity and unit cost, there is no way to determine that the wrong conclusions about waste have been reached in Cases 2 and 3.
All the above makes the use of operations unit cost and productivity as a proxies for drawing conclusions about waste/efficiency inaccurate. Operations unit costs are better suited for determining prices than for measuring waste/efficiency.
An Accounting Twist to Unit Cost Calculations
There is often a difference between the unit costs used in operations (discussed above) and the unit costs used in accounting. In accounting unit cost calculations, the denominator used is not an output of a process but rather the number of customers that use/buy the output. This twist usually creates more confusion in the use of unit cost as a proxy for efficiency because conclusions drawn from operations and accounting unit cost calculations can be different. An example we have encountered is shown below. Scenarios Y and Z represent different periods (months).
Here, rather than use the amount of electricity that they produce each month (generated output), an electric utility company uses the number of customers to determine their unit cost. This makes the conclusions drawn from the accounting unit cost ($ per Customer) different from the conclusions drawn from the operations unit cost ($ per MW-h). In the figure, the lower unit cost is highlighted in bold green.
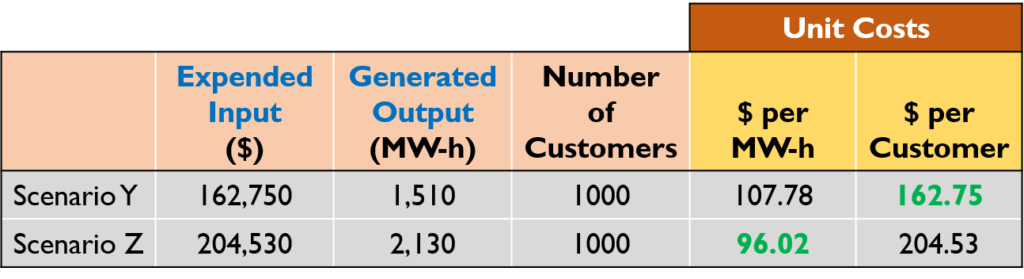
Accounting unit cost calculations are essentially used to determine financial viability. Just like the operations unit cost, they have limited value in determining waste/efficiency.
Non-Profit Overhead Ratio as a Proxy
The non-profit overhead ratio has been the mainstay proxy for efficiency in the non-profit sector for many years. Despite some recent acceptance that it is inaccurate and harmful (see here, here and here), its use remains widespread in the sector because there have been no viable alternatives (until now). The non-profit overhead ratio is defined as:
Non-Profit Overhead Ratio = Overhead Costs/Total Costs.
Note: The decision to designate this as “non-profit” overhead ratio is due to the fact that the non-profit sector defines overhead ratio different from the for-profit sector. The for-profit overhead ratio is defined as:
For-Profit Overhead Ratio = Overhead Costs/Revenue.
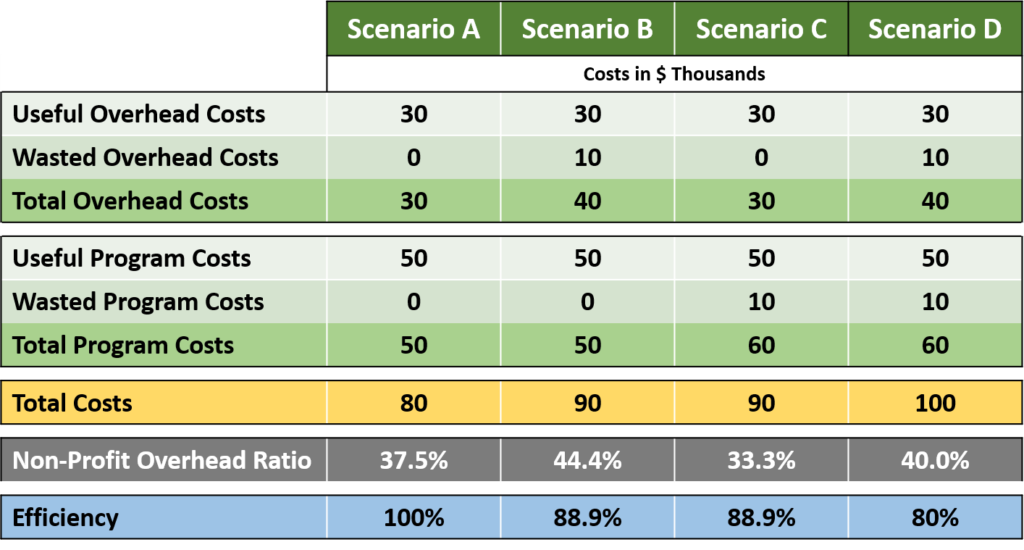
In the example below, we show how the non-profit overhead ratio always leads to incorrect conclusions about waste/efficiency. Each scenario represents the same non-profit with the same useful overhead and program costs but with different amounts of wasted overhead and program costs. Lower overhead ratios are typically considered to be less wasteful and thus more efficient.
In Scenario A, there is no waste in either the overhead or program costs. The overhead ratio is 37.5%. The efficiency is 100%.
In scenario B, $10,000 of waste has been introduced to the overhead costs compared to Scenario A. The overhead ratio increased to 44.4%. The efficiency dropped to 88.9%.
In Scenario C, $10,000 of waste has been introduced to the program costs compared to Scenario A. The overhead ratio is 33.3% (better than Scenario B and even better than Scenario A with no waste!!). This shows that the non-profit overhead ratio treats waste in program costs as a good thing. Meanwhile, the efficiency (88.9%) remains less than in Scenario A and same as Scenario B.
Scenario D has $10,000 of waste introduced to both the overhead and program costs. Comparing the overhead ratios of Scenario D (40%) to Scenario B (44.4%), the waste in the program costs actually made Scenario D incorrectly appear better (i.e. having less waste) than Scenario B! Meanwhile, the efficiency (80%) accurately indicates that this scenario is the worst of the four.
The overhead ratio is almost always inaccurate when it is used as a proxy for waste/efficiency.